
Getting Started with Data Analysis
Understand the foundational concepts of data analysis, including data types, sources, and the basic workflow used by analysts in their day-to-day work.
Read MoreLearn the core concepts and practical skills you need to understand data and make informed decisions in today's data-driven business world.
Whether you're starting your career or looking to strengthen your analytical abilities, we've put together essential guides covering everything from basic statistics to real-world analytics applications.

Explore our collection of articles covering key concepts in data analysis and business intelligence.
Understand the foundational concepts of data analysis, including data types, sources, and the basic workflow used by analysts in their day-to-day work.
Read More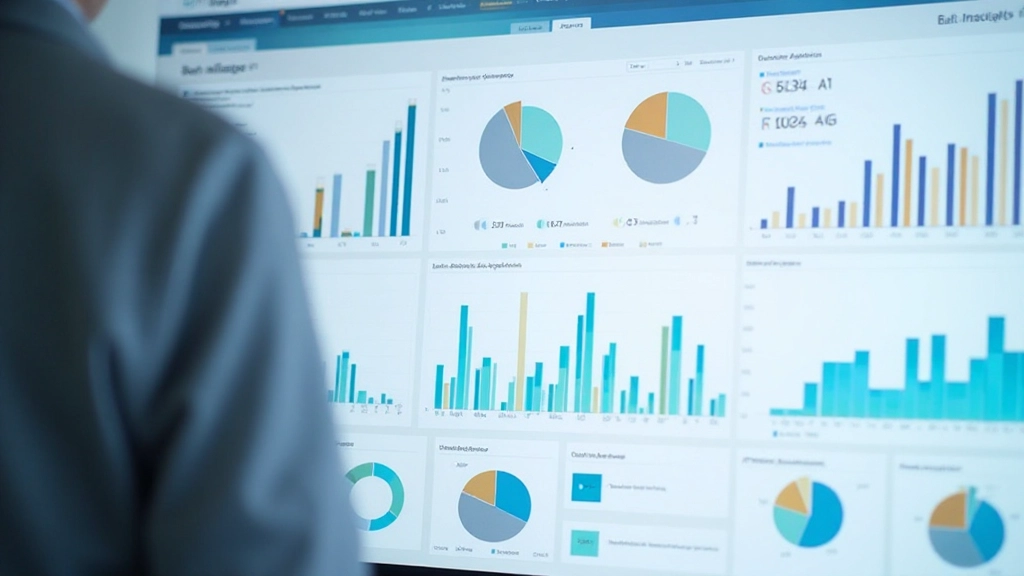
An introduction to the software and platforms used in business intelligence, from visualization tools to data warehousing solutions that drive business decisions.
Read More
Master the statistical concepts that form the backbone of data analysis—mean, median, standard deviation, correlation, and why they matter for interpreting data accurately.
Read More
Learn how to communicate your findings clearly through reports and visualizations that stakeholders actually understand and can act on.
Read MoreUnderstanding these fundamental ideas will give you a strong foundation for deeper learning in data analysis and business intelligence.
Different data comes in different formats—numerical, categorical, time-series. Knowing how to work with each type is essential for effective analysis.
Charts, graphs, and dashboards turn raw numbers into insights people can understand. Visual communication is critical for sharing findings.
Before drawing conclusions, you need to test whether your findings are real or just random chance. Statistical testing helps validate your insights.
Raw data is messy. You'll spend significant time preparing data—removing errors, handling missing values, and standardizing formats before analysis.
Data skills aren't just for specialized analysts anymore. Across industries—healthcare, finance, marketing, retail, technology—organizations need people who can interpret data and support better decision-making.
Whether you're looking to advance your career, transition into a new field, or simply understand the data-driven world around you, these fundamentals provide a practical starting point. You don't need advanced math or programming experience. The articles here focus on concepts, tools, and real-world applications you can actually use.
Start with the basics. Work through concepts at your own pace. Build skills gradually. That's how people develop genuine competence in data analysis—not through shortcuts, but through steady, focused learning.