Creating Effective Data Reports
Learn how to communicate your findings clearly through reports and visualizations that stakeholders actually understand and can act on.

Why Your Reports Matter More Than Your Analysis
Here's the thing — you can spend weeks uncovering incredible insights in your data, but if you can't communicate those findings clearly, it won't matter. Nobody's going to act on a report they don't understand. We've seen it happen plenty of times: brilliant analysis gets buried in confusing tables and jargon-heavy explanations, and executives end up making decisions without the insights you worked so hard to find.
Effective data reporting isn't just about presenting numbers. It's about telling a story with your data — guiding your audience from the question you asked, through the analysis you performed, to the conclusions you reached. When done right, a good report becomes the bridge between raw data and real business action.
The Core Structure: Four Essential Components
Every strong data report follows a proven framework. Get these right and you're halfway there.
Executive Summary
Start here. Most readers won't make it past this section, so it needs to contain your key findings and recommendations. One to two paragraphs max. The summary should answer three questions: What did you analyze? What did you find? What should we do about it?
Methodology & Context
Explain what you actually did. This section builds credibility. Cover the time period analyzed, data sources used, any limitations, and the specific questions you were trying to answer. Transparency here prevents misinterpretation later.
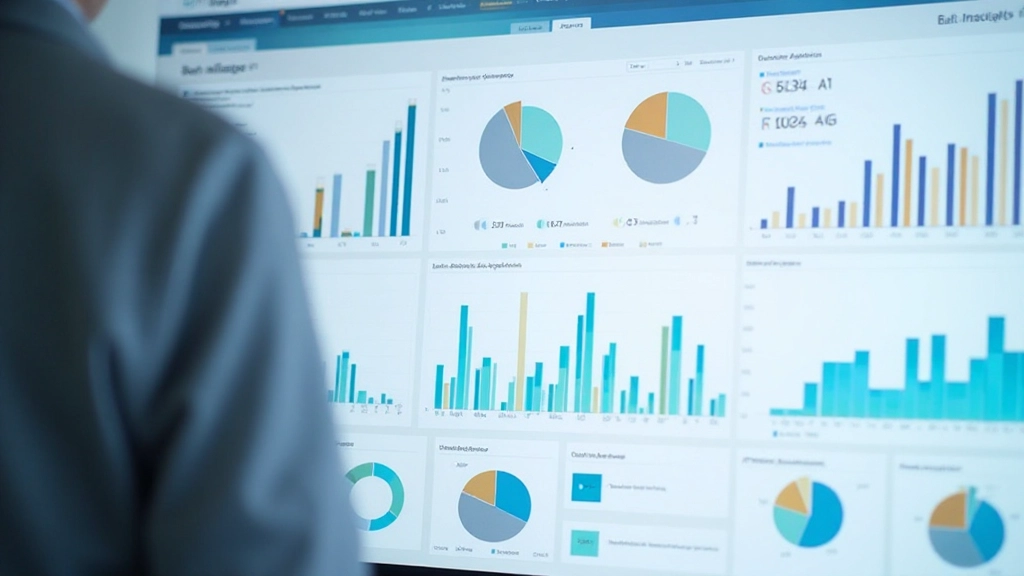
Findings & Visualizations
This is where your visuals shine. Use charts, graphs, and tables to show what the data revealed. Each visualization should have a clear title, labeled axes, and a brief explanation of what viewers should notice. One finding per chart — don't overload.
Recommendations & Next Steps
Close with clarity. What action should be taken based on these findings? Be specific. Instead of "improve customer retention," try "implement the loyalty program for high-value customers identified in segment 3." People need to know exactly what comes next.
Visualization Principles That Actually Work
Choosing the right chart type makes the difference between insights people understand instantly and data they have to squint at. A bar chart works great for comparisons. Line charts show trends over time. Pie charts? They're rarely the best choice, honestly — people struggle reading them.
Color matters too. Don't use red and green together if your audience includes color-blind viewers — roughly 8% of men have some form of color blindness. Keep your color palette limited to 3-5 colors maximum. Use color to highlight what matters, not to decorate.
And here's something many analysts skip: label your axes clearly. "Units Sold" is better than "Sales." "Customer Acquisition Cost by Channel" tells people what they're looking at immediately. Every chart needs a title that explains the key insight, not just a generic label.


Know Your Audience — Adjust Accordingly
A report for your CEO looks different from a report for your analytics team. The executive version needs minimal technical detail and maximum clarity. Lead with business impact. An internal technical report? You can include more methodology and statistical confidence intervals.
Ask yourself: What does this person care about? A marketing director wants to know if a campaign worked and what to do next. A CFO wants budget impact. The product team wants to understand user behavior. Tailor your findings to what matters to them. Remove anything that doesn't support their decision-making.
Length matters too. We recommend 3-5 pages for executive summaries, 10-15 pages for detailed reports. Anything longer and people won't finish it. If you've got extensive supporting data, put it in an appendix that people can reference if they need deeper detail.
Practical Tips for Report Quality
Use Consistent Formatting
Same fonts throughout. Consistent color scheme. Aligned margins. It sounds basic, but inconsistent formatting makes reports look unprofessional and distracts readers from your actual findings.
Tell the Story in Sequence
Don't jump around. Take readers on a journey: here's the question, here's what we found, here's what it means, here's what we should do. A logical flow keeps people engaged.
Highlight Key Numbers
When you mention a crucial finding, make it stand out. Use bold text, call-out boxes, or larger font sizes. People remember visually prominent information better.
Include Data Quality Notes
Be honest about limitations. If you're missing data for certain periods, say so. If your sample size is smaller than ideal, mention it. Trust comes from transparency.
Add Context to Numbers
A 15% increase means more when you compare it to last quarter (10%) or to industry average (8%). Context transforms raw numbers into meaningful insights.
Proofread Everything
Typos and grammatical errors undermine your credibility. A professional report reflects careful work. Spend 15 minutes doing a final read-through before sharing.
Putting It All Together
Creating effective data reports comes down to one core principle: make it easy for your audience to understand and act. Start with a clear structure. Use visualizations strategically. Know who you're writing for. Pay attention to details like formatting and clarity.
The best reports aren't the ones with the most data — they're the ones that communicate the right insights to the right people in a way that drives decisions. That's what separates good analysis from great analysis. You've done the hard work uncovering the insights. Now make sure people actually understand them and can use them.
Remember: Your report is only successful if your audience understands it and takes action. Test your draft with a colleague outside your team. If they're confused about something, rewrite it.
Continue Learning


About This Guide
This article provides educational information about data reporting best practices and general principles. The specific techniques and recommendations should be adapted to your organization's unique needs, industry standards, and stakeholder requirements. While these approaches are widely used in data analysis and business intelligence, individual circumstances vary. Consider consulting with experienced data professionals in your field for guidance tailored to your specific situation.